Military Power Comparison
Select the two countries you want to compare; metrics like personnel count, defense budget, fighter aircraft, tanks, artillery, naval vessels, submarines, and drones are shown side by side. The data comes from a fixed reference dataset and is not real-time.
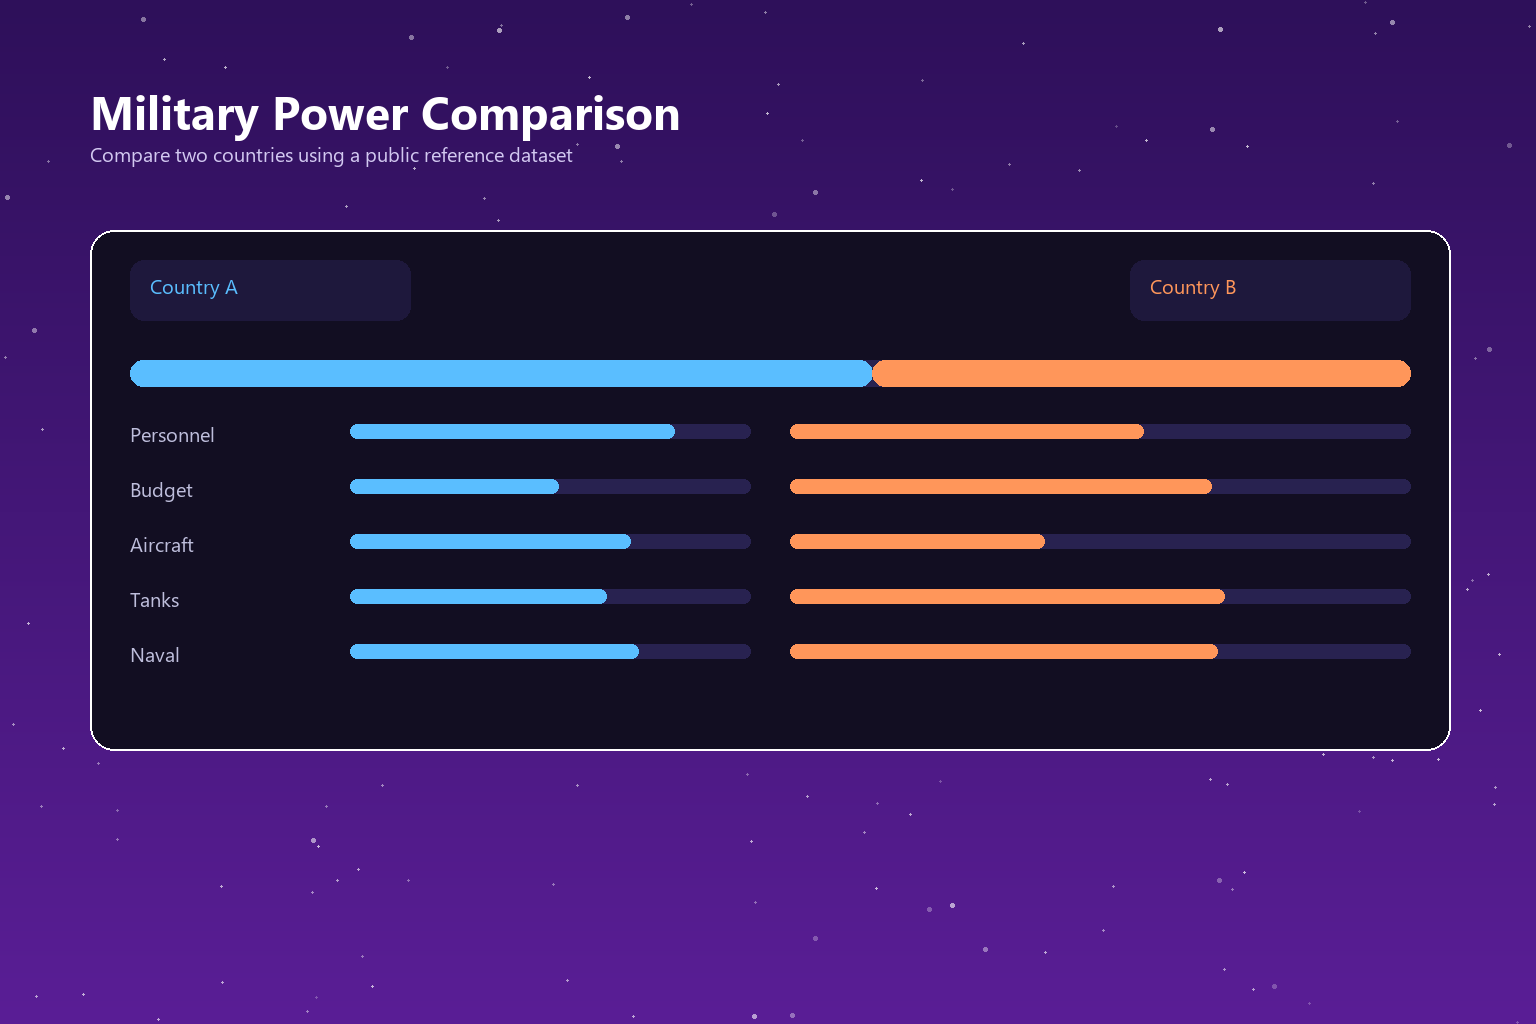
Overall score: Russia
| United States | Russia | |
|---|---|---|
| Personnel (thousands) | 1.328 | 1.320 |
| Budget (Billion $) | 916 | 109 |
| Fighter aircraft | 1.854 | 809 |
| Tanks | 2.640 | 5.740 |
| Artillery | 1.543 | 5.157 |
| Naval vessels | 472 | 419 |
| Submarines | 68 | 64 |
| Drones | 300 | 200 |
Data last updated: 2026-03-27
How to interpret the result
The overall score bar shows the ratio of the two countries' weighted total scores. Each row in the table visually indicates (with colored bars) which country leads numerically on that specific metric.
How is the overall score calculated?
Each country's metrics (personnel, budget, fighter aircraft, tanks, artillery, naval vessels, submarines, drones) are multiplied by fixed weights and summed to produce a single overall score. Budget and personnel carry the highest weight; this weighting is meant to offer a simple, transparent comparison, not an official military power index.
Formula
- The metrics (personnel, budget, fighter aircraft, tanks, artillery, naval vessels, submarines, drones) for the two selected countries are pulled from the fixed dataset.
- Each metric is multiplied by a predetermined weight (budget and personnel carry the highest weight).
- The weighted values are summed to produce a single overall score for each country.
- The two scores are compared to calculate the percentages shown in the overall score bar.
- For each metric individually, which country is numerically higher is shown with colored bars.
Example comparison
When comparing the US and Russia, the US stands out with a higher defense budget and air capacity, while Russia has a numerically larger land force (tanks and artillery).
Tips for interpreting the comparison
- The overall score is a weighted sum of different metrics; on its own, it doesn't fully capture a country's actual military strength.
- A metric-by-metric comparison (such as tank count alone) can offer a more specific perspective than the overall score.
- Check the dataset's update date — defense budgets and inventories can change over the course of a year.
Comparisons
High budget and air capacity
Has the highest defense budget in the world.
Large land force inventory
Stands out in tank and artillery counts.
Highest personnel count
Ranks among the highest in active-duty personnel worldwide.
Strong regional land and air capacity
Has notable inventory figures among NATO and regional countries.
Guide to military power comparison
Comparing countries' defense capabilities is a commonly searched topic for international relations, defense policy, or general curiosity. However, such comparisons usually rely on complex, multi-dimensional data; this tool presents the most commonly used metrics side by side in a simple, easy-to-understand format.
The dataset used is a fixed reference set compiled from public sources like SIPRI (Stockholm International Peace Research Institute), the World Bank, and Global Firepower. This data is updated as of a specific date and is not a live intelligence feed; the tool therefore offers a retrospective snapshot.
The overall score is a weighted sum of eight different metrics (personnel, budget, fighter aircraft, tanks, artillery, naval vessels, submarines, drones). The weights are set to emphasize budget and personnel's role in overall military capacity, but this weighting is only a simplified comparison tool, not an official index.
An important caveat: this score does not reflect a country's actual combat capability, quality of military training, technological superiority, strategic alliances, or current geopolitical situation. Numerical inventory size alone is not a guarantee of military effectiveness.
This tool can be used as a starting point for general information gathering, preparing educational presentations, or quickly comparing two countries' numerical defense capacity. For precise, current analysis, consulting original sources (SIPRI, World Bank, official defense ministry reports) is recommended.
FAQ
Is this tool's data live or real-time?
No. The tool uses a fixed reference dataset compiled at a specific date; it does not reflect changes after the update date shown on the page.
What sources are the data based on?
The data is compiled for reference purposes from public sources like SIPRI, the World Bank, and Global Firepower; it is not official military intelligence data.
Is the overall score a definitive measure of military superiority?
No. The score is a weighted combination of selected metrics; it does not include factors like training level, technology, strategic alliances, or current operational status.
Why does the submarine count show zero for some countries?
This indicates that the country's recorded submarine inventory in the dataset is zero; this information is compiled from the reference sources.
Can I request that a new country be added?
This version has a fixed country list; the list may be expanded in future updates.
What currency are the budget figures in?
Budget figures are in billions of US dollars and reflect estimated annual defense spending from the reference sources.
What does the personnel count represent?
The personnel count shows the number of active-duty service members, in thousands; it does not include reserve forces.
Can I use this tool for academic or journalistic purposes?
The tool offers a general reference point, but for academic or journalistic use, we recommend consulting the original sources (SIPRI, World Bank, etc.).
Related tools
Embed this tool on your site
<iframe src="https://pinfox.tech/en/tools/general/military-power-comparison/?embed=1" width="100%" height="720" loading="lazy" style="border:0;border-radius:12px;overflow:hidden" title="Military Power Comparison - Pinfox"></iframe>